Poisson Stationarity Analysis
Poisson Stationarity Analysis is one of the key components used in the evaluation of an earthquake catalogue to check if it follows the Poisson distribution in terms of time. This script analyzes exactly the temporal distribution of the catalogue by calculating inter-event times and fitting statistical models.
[1]:
import pandas as pd
import numpy as np
import os
import matplotlib.pyplot as plt
from scipy.stats import expon, lognorm, weibull_min
from openquake.plt.interevent import analyze_interevent_times
In this notebook, we utilize analyze_interevent_times function, which is available in openquake.plt.interevent.
Here is a concise breakdown of its tasks:
Computes the inter-event time (the time gap between consecutive earthquakes).
Fits three probability distributions—Exponential, Lognormal, and Weibull—to the time intervals.
Uses the Akaike Information Criterion (AIC) to determine which distribution best represents the data (lower AIC is better).
Generates a probability density plot to compare the histogram of data against the fitted theoretical curves.
Outputs key metrics, including the number of mainshocks, mean return period, the Coefficient of Variation (CV), and the best-fitting model.
[2]:
output_dir = os.path.join("..", "output")
if not os.path.exists(output_dir):
    os.makedirs(output_dir)

file_name = "interevent_log_plt.png"
output_map = os.path.join(output_dir, file_name)

analyze_interevent_times(
    catalogue_path="../data/hmtk_sample_catalogue.csv",
    bin_scale="logarithmic",
    num_bins=50,
    output_png=output_map
)
Done! Saved to: ../output/interevent_log_plt.png
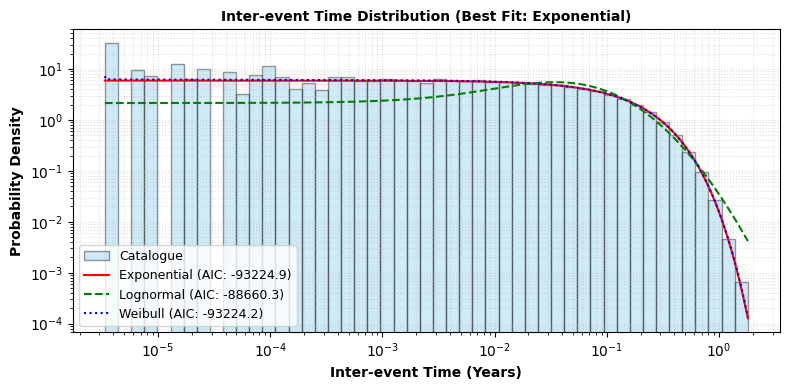
========================================
         STATISTICAL SUMMARY
========================================
Total Analyzed Events        : 59501
Calculated Intervals         : 59500
Mean Interval (μ)            : 0.1681 years
Coefficient of Variation (CV): 1.00
Best-fitting Model (min AIC) : Exponential
========================================
[3]:
output_dir = os.path.join("..", "output")
if not os.path.exists(output_dir):
    os.makedirs(output_dir)

file_name = "interevent_lin_plt.png"
output_map = os.path.join(output_dir, file_name)

analyze_interevent_times(
    catalogue_path="../data/hmtk_sample_catalogue.csv",
    bin_scale="linear",
    num_bins=50,
    output_png=output_map,
)
Done! Saved to: ../output/interevent_lin_plt.png
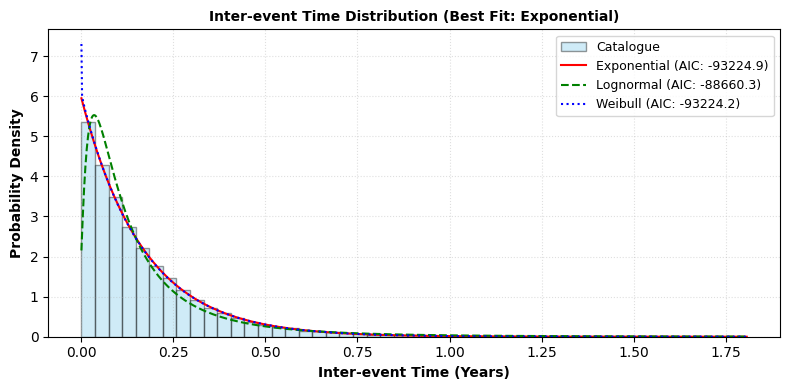
========================================
         STATISTICAL SUMMARY
========================================
Total Analyzed Events        : 59501
Calculated Intervals         : 59500
Mean Interval (μ)            : 0.1681 years
Coefficient of Variation (CV): 1.00
Best-fitting Model (min AIC) : Exponential
========================================